Production
ENRU
Case study - custom ERP

Production is no longer planned by eye.

A womenswear seller with its own sewing factory: four seller accounts across two major e-commerce marketplaces, five production workshops, fabrics with lead times up to 38 days. The system computes the whole production order: which items, in which batches, in which weeks to cut and sew, which fabrics to order and when, and what to ship to which marketplace warehouse.

FastAPIPostgreSQL 16CeleryReact 18 TypeScriptTwo marketplace APIsGoogle SheetsTelegram
58
data tables across 20 backend modules
84
API endpoints, every module with its own README
400+11
backend and frontend autotests, run every night
4
seller accounts on two marketplaces in one system
5
workshops with capacity tracked separately
14 weeks
planning horizon, recomputed on a button
01 Context and pain

The factory runs, yet "what to launch" is decided by hand

The client owns a sewing factory and sells through four storefronts on two marketplaces. There is one factory and four sources of demand. Every week somebody sat down and worked out by hand what to move and where to squeeze it in.

Demand in four accounts, one factory

The same item sells from four storefronts. To know how much to sew you must add up the orders of all four, then send the finished batch back in proportion to their sales. In spreadsheets this was done by hand and drifted apart.

Fabric travels longer than the garment is sewn

Fabric lead times reach 38 days, while the cut-to-shelf cycle fits in three weeks. So the fabric order is decided a month and a half before the item reaches the shelf. Miss the ordering point and you miss the season.

Workshop capacity was not a number

How many hours a week cutting, sewing, ironing, quality control and packing actually deliver, nobody knew. The plan was set by feel, and the bottleneck surfaced mid-week, when moving anything is already too late.

Cost lived in the technologist's files

Fabric consumption norms and operation roubles sat in personal spreadsheets. The same item cost different amounts in different files, and every profit calculation started with an argument about the numbers.

02 Architecture

Four accounts in, a weekly plan out

Every night Celery pulls four seller accounts from two marketplaces into PostgreSQL. Production reference data and the planning engine turn orders into weekly batches. People work in a React portal, managers see the same truth in a Google Sheet, urgent things arrive in Telegram. External systems are read only: the system writes nothing back.

NIGHTLY PIPELINE Marketplace A 2 seller accounts orders · stock · funnel nightly sync Marketplace B 2 seller accounts orders · finance · ads reports by request Technologist files fabric consumption norms roubles per operation uploaded as an xlsx template Sync layer Celery Beat, a log per run idempotent imports memory of a requested report: after a restart it is downloaded, not ordered again rate limit per account external systems are read only PostgreSQL 16 58 tables · 28 migrations Redis 7: cache and broker a backup before every release Planning core specs: fabrics, bills of materials, workshops, parameters plan_engine: demand model, branch and bound, versions production: batches, statuses, fabric orders, exports Production portal Plan · Workload · Materials Cutting · Sewing · Delivery 5 colour schemes, light and dark Google sheet the same truth for managers rendered before the pull runs Telegram a fabric ordering point is due a workshop is overloaded this week HARD RULE The system writes nothing into external systems. Fabric orders, supplies and prices stay with people: the system computes and explains, and leaves the decision and the button to a human.
20backend modules, each with its own README
28schema migrations, releases stay additive
07:35the sheet is rendered before the pull, not into it
0write methods against external APIs
03 Demand model

How many orders there will be if nothing changes

Demand per item is assembled from the actual orders of all four accounts, not from plans and not from wishes. It is then spread across the weeks of the horizon with the seasonal coefficient of the category and a manual correction when a manager knows something the history does not.

Orders, not buyouts

The pace is counted on orders: a buyout arrives later and shifts the picture two weeks back. For the decision "launch a batch or not" what matters is the speed of demand today.

Seasonality as a monthly coefficient

A category has its own monthly profile, and a single item can override it. The coefficient sits in the table as its own column: a person sees exactly what lifted the plan.

A manual correction with an author

A manager can set the pace and a multiplier by hand, with a comment. The correction does not dissolve into the calculation: in the "Why" block it stands as its own line with the author.

Day boundaries follow Moscow time. The server lives in UTC while the business counts a day in Moscow. Until that was pinned down, evening orders fell into the next day and the sales pace jumped for no reason. Every analytics period is now cut by the Moscow day.

04 Planning engine

A weekly grid, batches, and an explanation for every number

The engine places batches across weeks so that the profit of the horizon is the highest and the workshops are not overloaded. Every batch has three weeks: cutting, sewing, delivery. A batch is a multiple of the minimum launch: a lay smaller than that does not pay off the cutting.
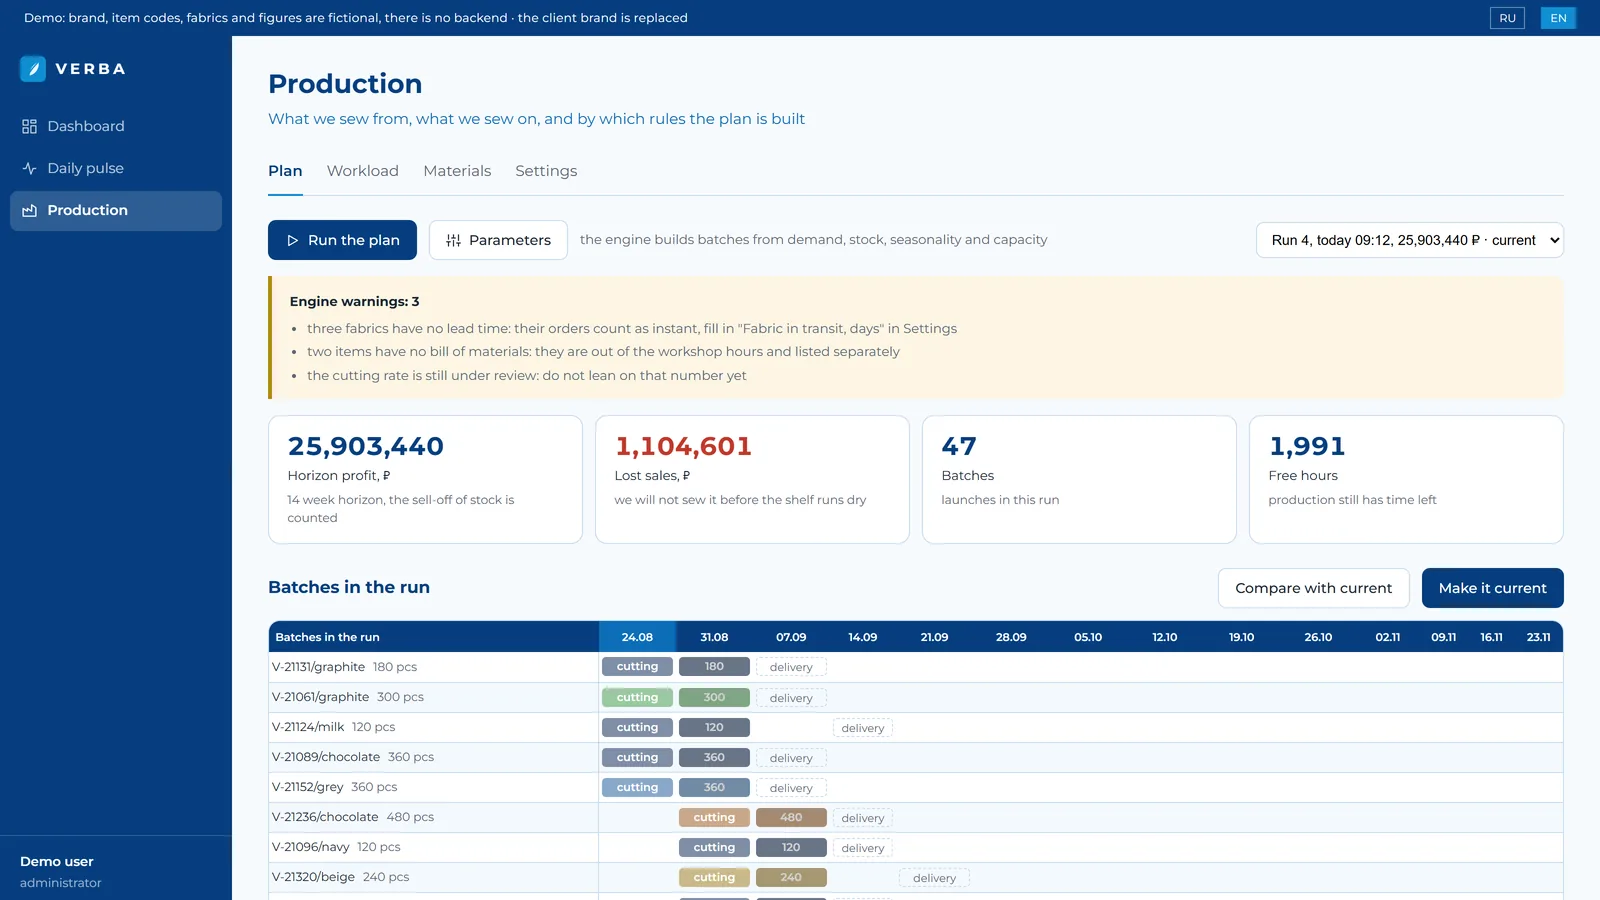
Weekly plan: batches across weeks with cutting, sewing and delivery stages, fabric orders in the rows below
The Plan tab: the horizon summary, engine warnings, batches as coloured blocks across weeks, and fabric order rows underneath. A click on a batch opens a card with the calculation and the answer to "why this exact week".

What the engine computes

A search over launch options with the obviously worse branches cut off, then a rebalance across workshops. The result is a version of the calculation: it can be compared with the current plan and only then made current.

Versions, not overwrites

Every run is saved as its own version with its profit and batch count. The previous working plan does not vanish: unlaunched batches are closed, launched ones live on through their own life cycle.

Warnings instead of a silent default

A fabric with no lead time, an item with no bill of materials, a workshop rate still under review: the engine says so in a list at the top of the screen. A silent default would be unacceptable here: the plan would look honest while being made up.

Lost sales counted in money

What will not be sewn before the shelf runs dry is shown in roubles next to the horizon profit. That is the only way to compare "launch now" and "wait" in the same units.
05 Workshop load

Will the workshops manage what the week asks of them

Five workshops, each with its own capacity and its own rate. The load is computed on the fly on every request: the resulting hours and percentages are stored nowhere, otherwise the load would have two versions of the truth.

hours per piece per workshop = operation roubles from the bill of materials / workshop rate, ₽ per hour
workshop capacity, h per week = people × shift hours × shifts per week × (1 − reserve) − outsourced hours
workshop load per week, h = sum over the batches of that week (pieces × hours per piece)
load, % = hours needed / capacity × 100

Example: 3 people, 8 hours, 5 shifts, a 12% reserve and no outsourced hours give 3 × 8 × 5 × 0.88 = 105.6 hours. Sewing a skirt at 495 ₽ with a sewing rate of 2,202 ₽ per hour is 0.225 hours, that is 13.5 minutes per piece; a batch of 240 takes 54 hours.

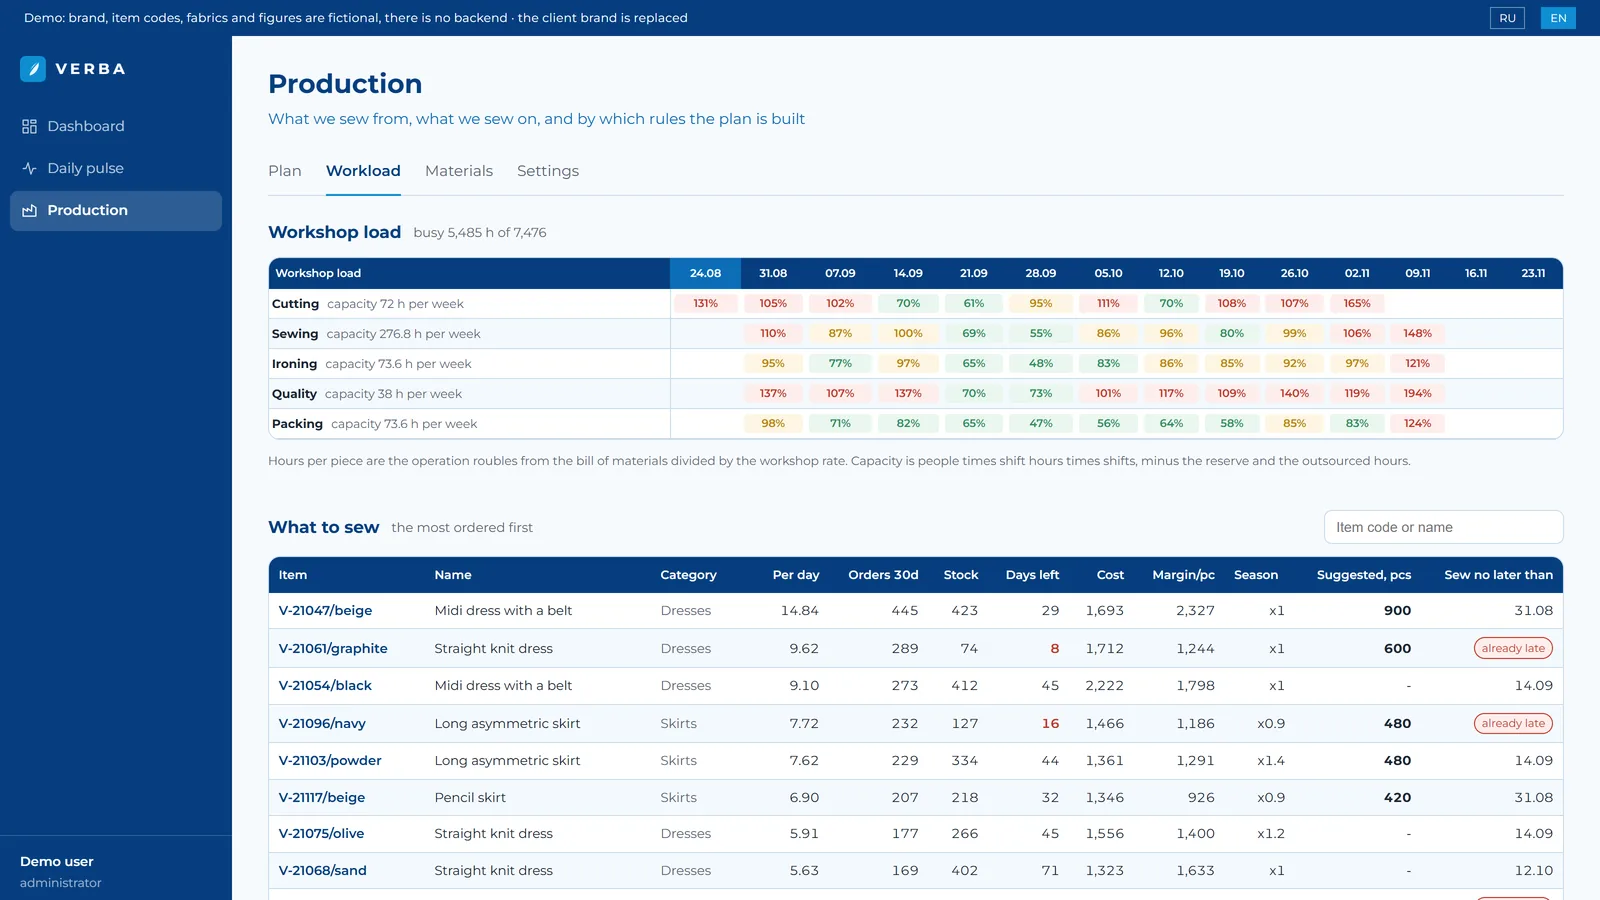
Workshop load per week with a traffic light on the percentages and the what-to-sew table
The Workload tab: percentages per week with a traffic light (over 100 red, from 85 yellow) and the "What to sew" table with stock, order speed, margin and the date after which launching is already too late.

Empty is more honest than zero. If a workshop has no headcount, it has no capacity: the cell is grey with the reason "the ironing workshop has no headcount", not a zero and not 100%. If outsourced hours ate the whole capacity, the batch hours are still counted but there is no percentage, and the workshop header keeps the number with an explanation. There can be several reasons, and the cell puts them into one sentence.

5workshops: cutting, sewing, ironing, QC, packing
>100%a red cell: this week will not fit
85-100%yellow zone: no slack left for rework
0stored computed hours: everything is recomputed
06 Fabrics and the ordering point

The ordering calendar is counted backwards from the cutting week

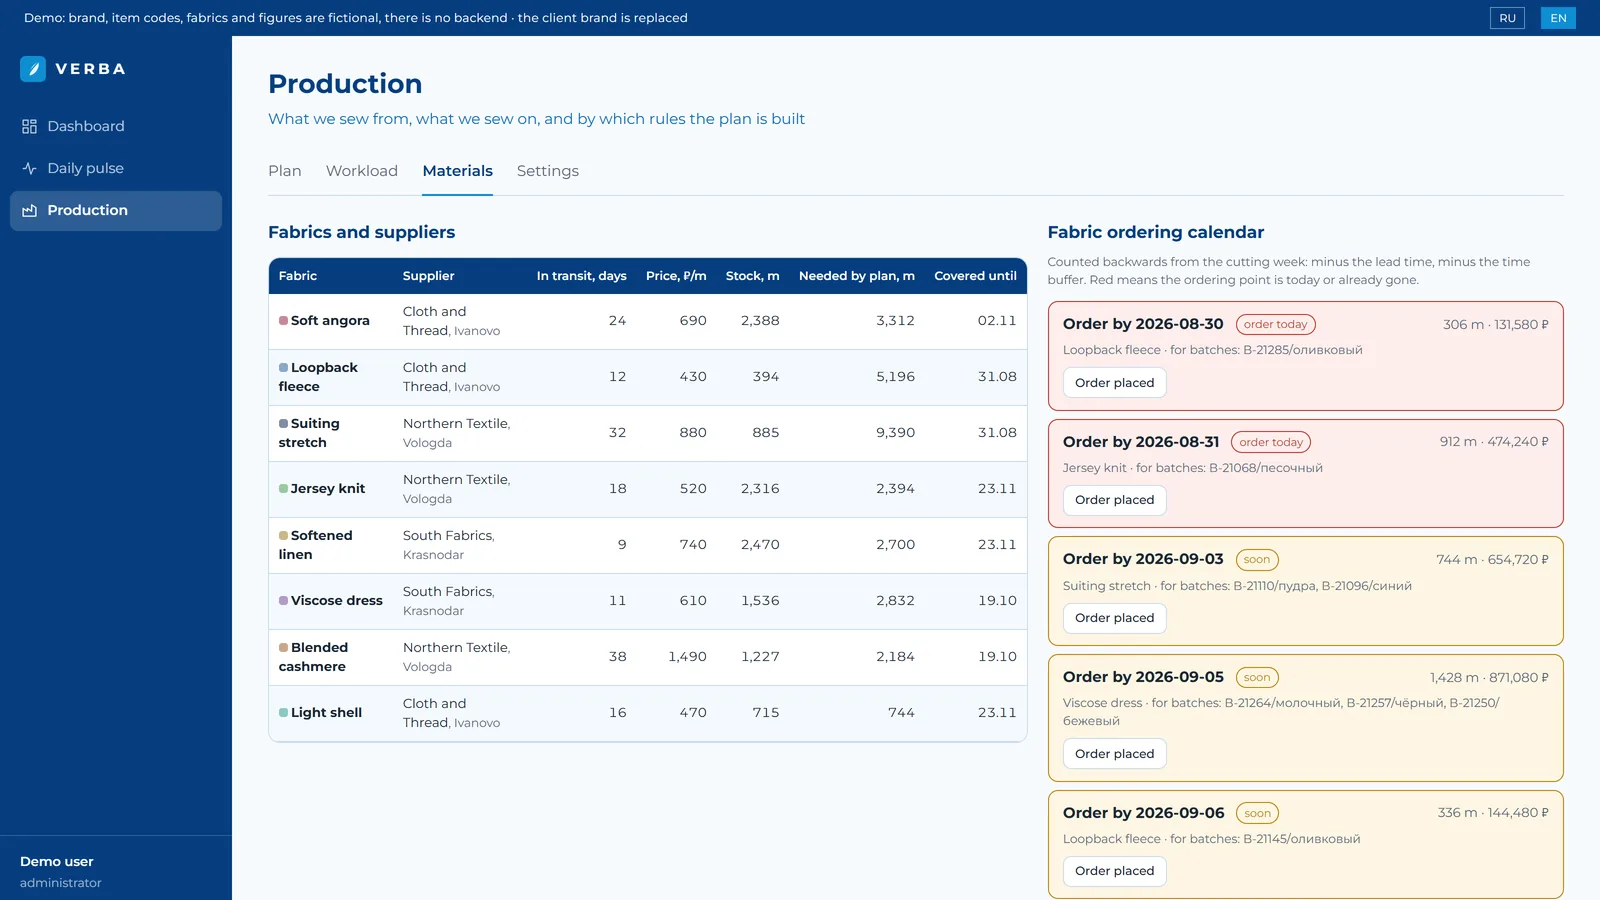
Fabric travels between 9 and 38 days depending on the supplier. The system takes the cutting week, subtracts the lead time and the time buffer and gets the date after which ordering is too late. Rows whose ordering point has passed stand in red at the top.

Fabric table with lead times and the ordering calendar with order-by dates
The Materials tab: on the left the fabrics with lead time, price, stock and the need coming from the working plan; on the right the ordering calendar with the "order by" date and the batches that order is for.

Order placed, fabric arrived

Two buttons on a calendar row: the first creates an order with a planned arrival date, the second confirms the arrival with the actual date and metres. The gap between plan and fact is visible and feeds the next recalculation.

The time buffer is a parameter

On top of the lead time sits a buffer for a supplier slipping and for defects. It is a setting, not a constant in the code: a supplier's lead time changes with a phone call, while a code release takes time.

The signal goes to Telegram

When the ordering point is due, the manager gets a message. Waiting for someone to open the tab is not an option here: a missed fabric order costs a month.

07 Batch life

From a line in the plan to stock in a marketplace warehouse

There is one working plan. A batch goes through six states, and at every transition the system takes the fact: a date and a quantity. Any gap against the plan is visible at once and takes part in the next calculation.

Plannedthe batch was proposed by the engine and accepted
Fabric orderedthe order is placed, the planned arrival is known
Cutfact: the date and how many pieces were cut
Sewnthe sewing fact, the batch is ready to ship
Shippedon its way to the marketplace, the destination account is set
Acceptedleaves the plan and lives on as ordinary stock

Where to ship is computed, but edited by hand. By default a finished batch is split between accounts in proportion to their orders over the period. A manager can rewrite that split: they have reasons the data does not carry, for example a warehouse that stopped accepting supplies.

08 Plain language

No buffers, drums or bottlenecks on the screen

Underneath it is ordinary theory of constraints. None of its vocabulary reaches the screen: people on the shop floor use different words, and there is no reason to teach them a glossary for the sake of an interface.

In the code and the specIn the interface
item_keyItem
bill of materialsWhat we sew it from
consumption normFabric per piece, m
logistics lead timeFabric in transit, days
production cycleFrom cutting to the shelf, weeks
bufferTime buffer
reorder pointOrder by
workshop capacityHours per week
branch and boundthe "Run the plan" button
margin per unitEarned on one piece

Every computed number carries a "how this was counted" tooltip: the formula in words and the numbers substituted into it. A number that cannot be explained in ten seconds counts as unfinished in this interface.

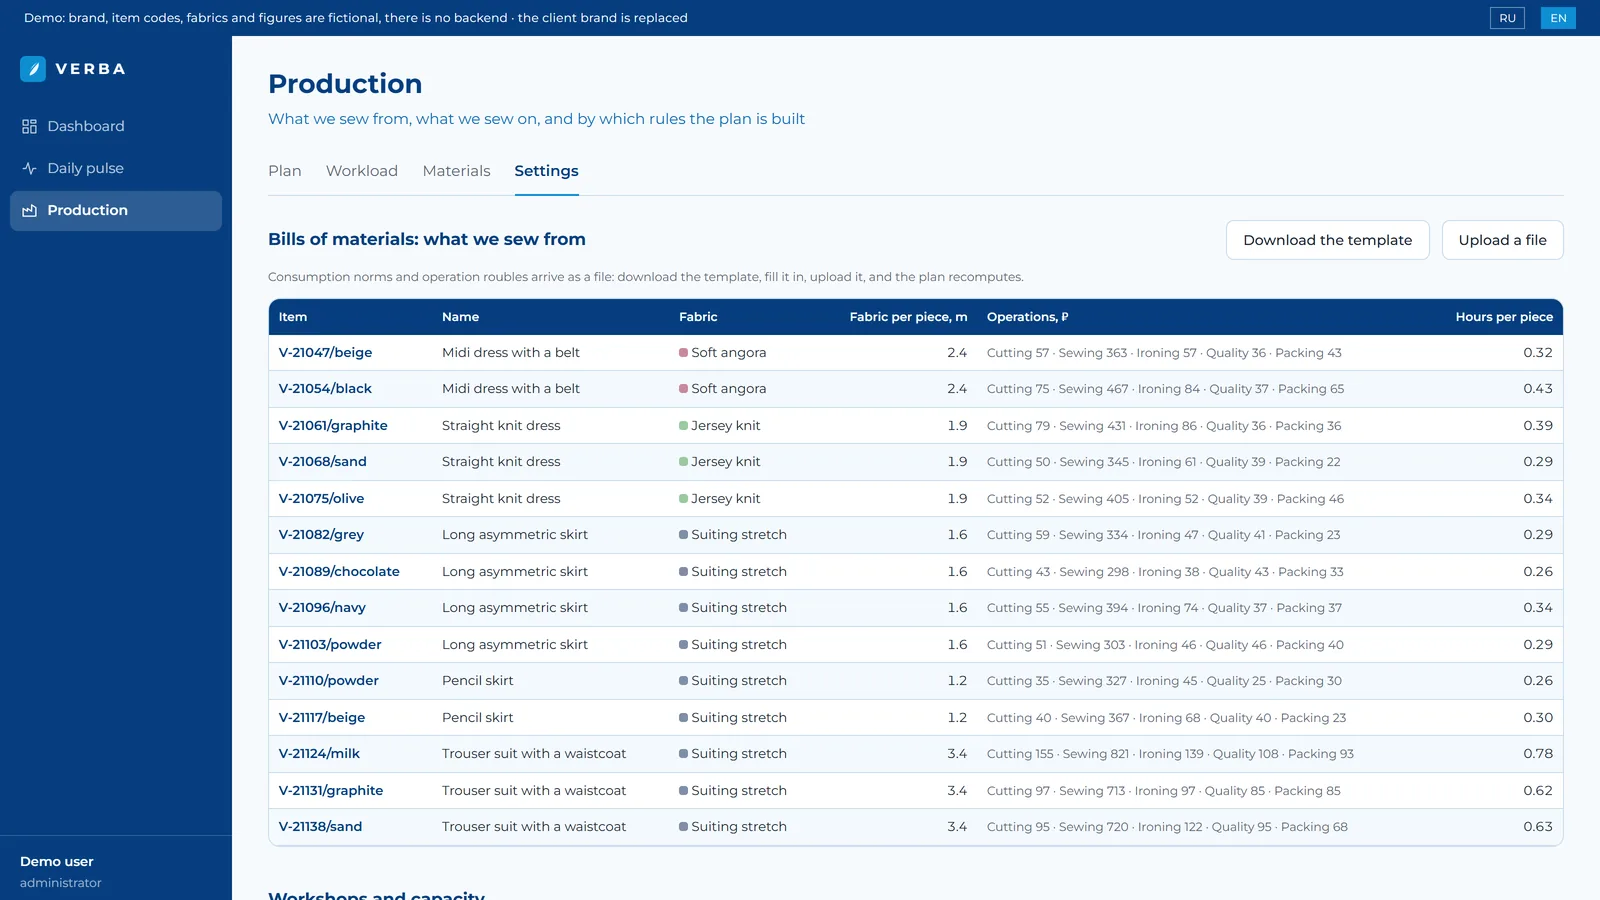
Bills of materials: fabric, consumption norm, operation roubles and hours per piece
Bills of materials arrive as a file: download the template, fill it in, upload it. Next to them sit workshop capacities and the calculation parameters, each explained in words.
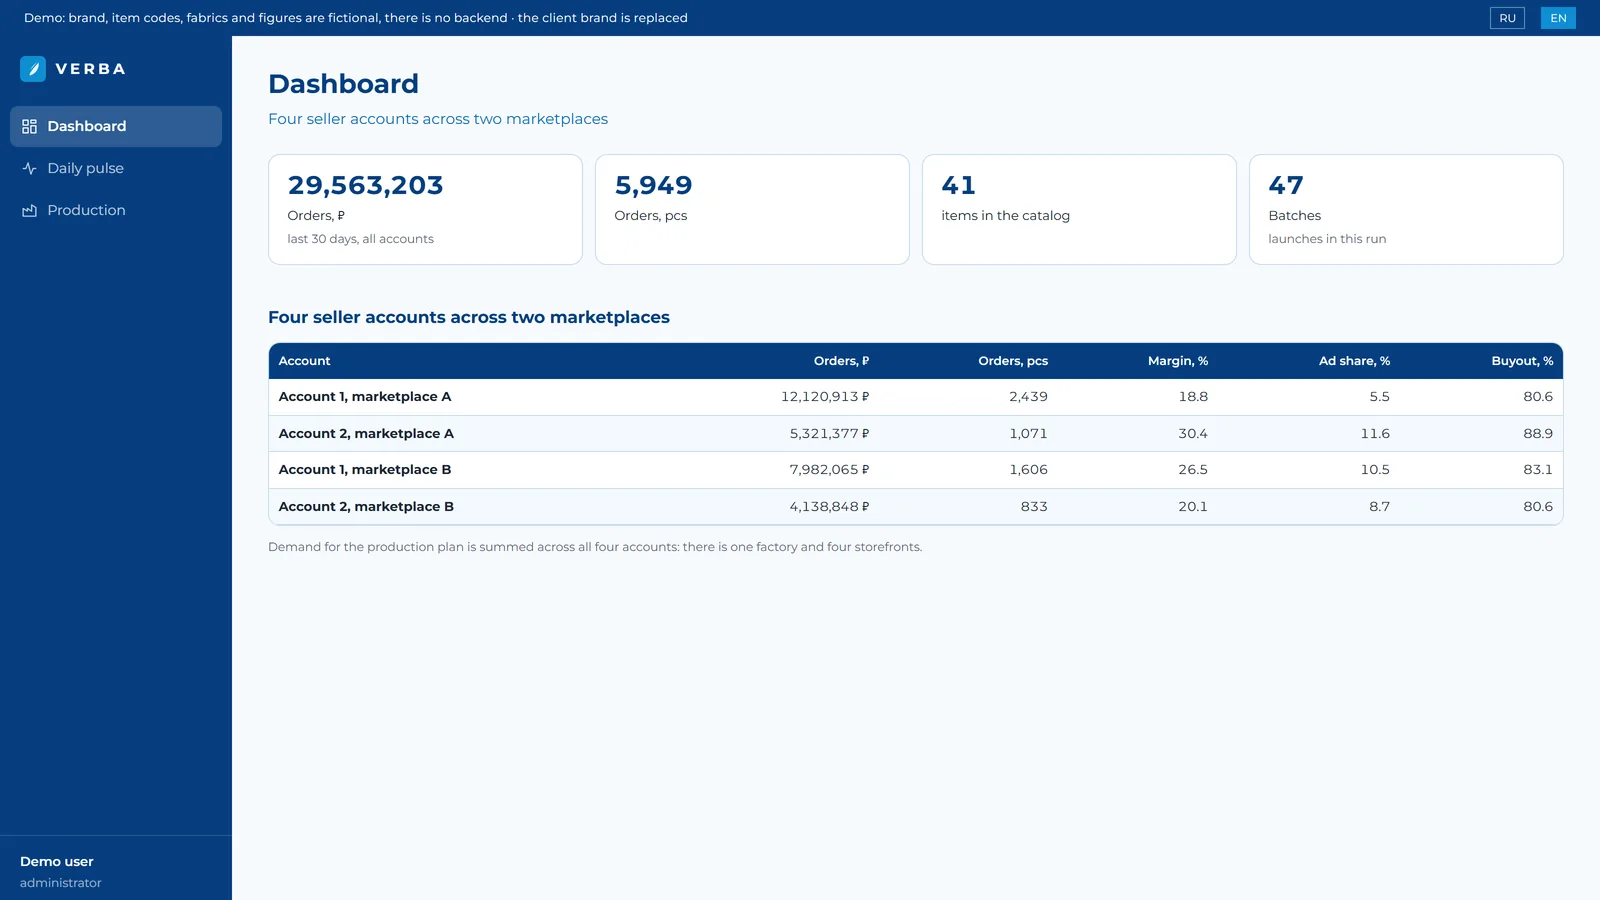
Dashboard: summary across four seller accounts on two marketplaces
The dashboard: a summary across four accounts. Demand for the production plan is summed across all four, because there is one factory and four storefronts.
09 Results

What changed for the client

BeforeAfter
Demand was counted per account, while the factory is one. Orders of four accounts are added up by item key, and the finished batch is sent back in proportion to their sales.
"What to launch" was decided by a person with a spreadsheet. The engine proposes batches across weeks and names the horizon profit and the lost sales in roubles. The decision stays with a human, but now it comes with a number.
Workshop capacity was a feeling. Five workshops with separate capacity and weekly load, and a red cell is visible before the week begins.
Fabric was ordered whenever somebody remembered. An ordering calendar counted backwards from the cutting week, with an "order by" date and a Telegram signal.
Cost lived in personal files. Bills of materials are uploaded as a template and become the single source of norms and operation roubles for every calculation.
Nobody could explain where a number came from. Every computed number carries the formula in words with the substituted values, and every batch carries a "Why" block.

Kirill Sedov

Business analyst and systems builder. I start with the business process and the data contract, then automate. Here the manual guesswork of "what to move and where to squeeze it in" is replaced by a calculation that can explain itself.

Get in touch on LinkedIn