A custom back office for an apparel seller on Wildberries, a major e-commerce marketplace (600M+ monthly visits). The company runs $4M in monthly revenue, a catalog of 600+ SKUs, 12 seller accounts and about 30 users. One system now covers analytics, customer replies, product card creation and supply costing.
A fast-growing seller with 12 marketplace accounts. Each account had its own dashboard, its own API keys and its own spreadsheet. The numbers that ran the business were assembled by hand.
Every seller account is a separate cabinet in the marketplace. Orders, ads, stock and finance lived in 12 places. Nobody saw the whole company on one screen.
Managers copied figures from 5 or 6 marketplace screens into a daily control spreadsheet. Realistically 1 to 2 minutes per SKU. With over a thousand active SKUs in a single account, full manual coverage was physically impossible. The long tail of the catalog went unwatched.
The marketplace closes its finance report weekly, with about a 3-day delay. Real margin per SKU per day was unknown. Reports took hours and were already stale when finished.
At the starting point: 210 unanswered reviews and 1,023 unanswered customer questions across the accounts. New product cards took 15 to 30 minutes of manual work each, across 3 different systems.
Nightly Celery jobs pull 6 domains of the Wildberries API into PostgreSQL. A calculation layer turns raw rows into margins, alerts and cost. People work through the React SPA, through familiar Google Sheets, or simply receive alerts. Two automation pipelines push work back into the marketplace.
Engineering details that keep it alive: per-domain rate limits on marketplace calls, idempotent upserts everywhere, advisory locks around recalculations, a watchdog that unsticks hung syncs, and an audit log on every mutation in the money-critical modules.
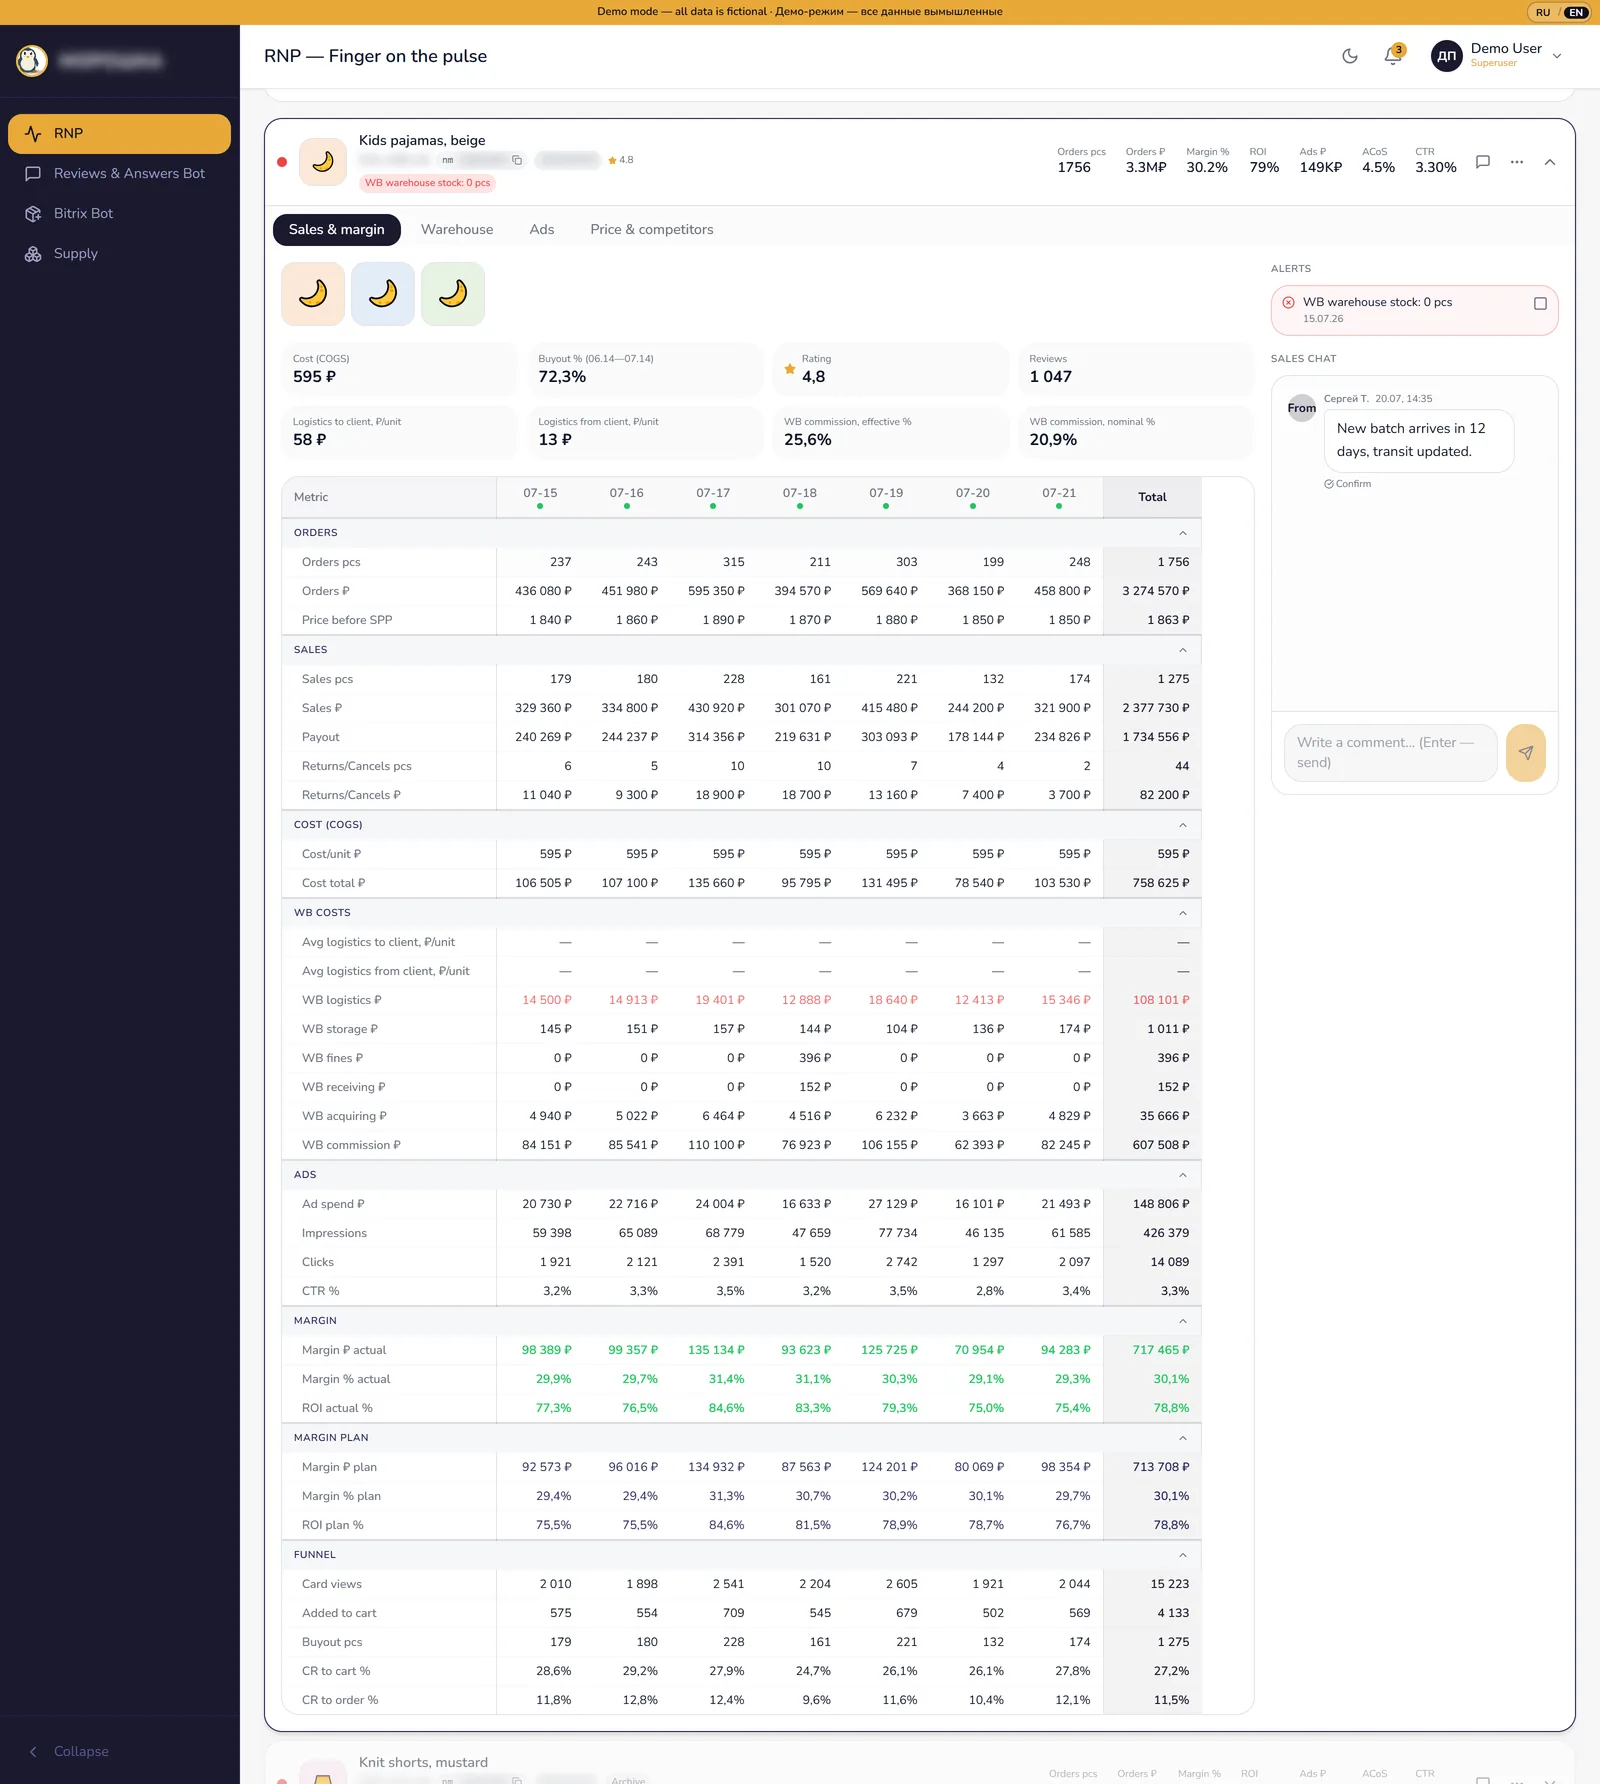
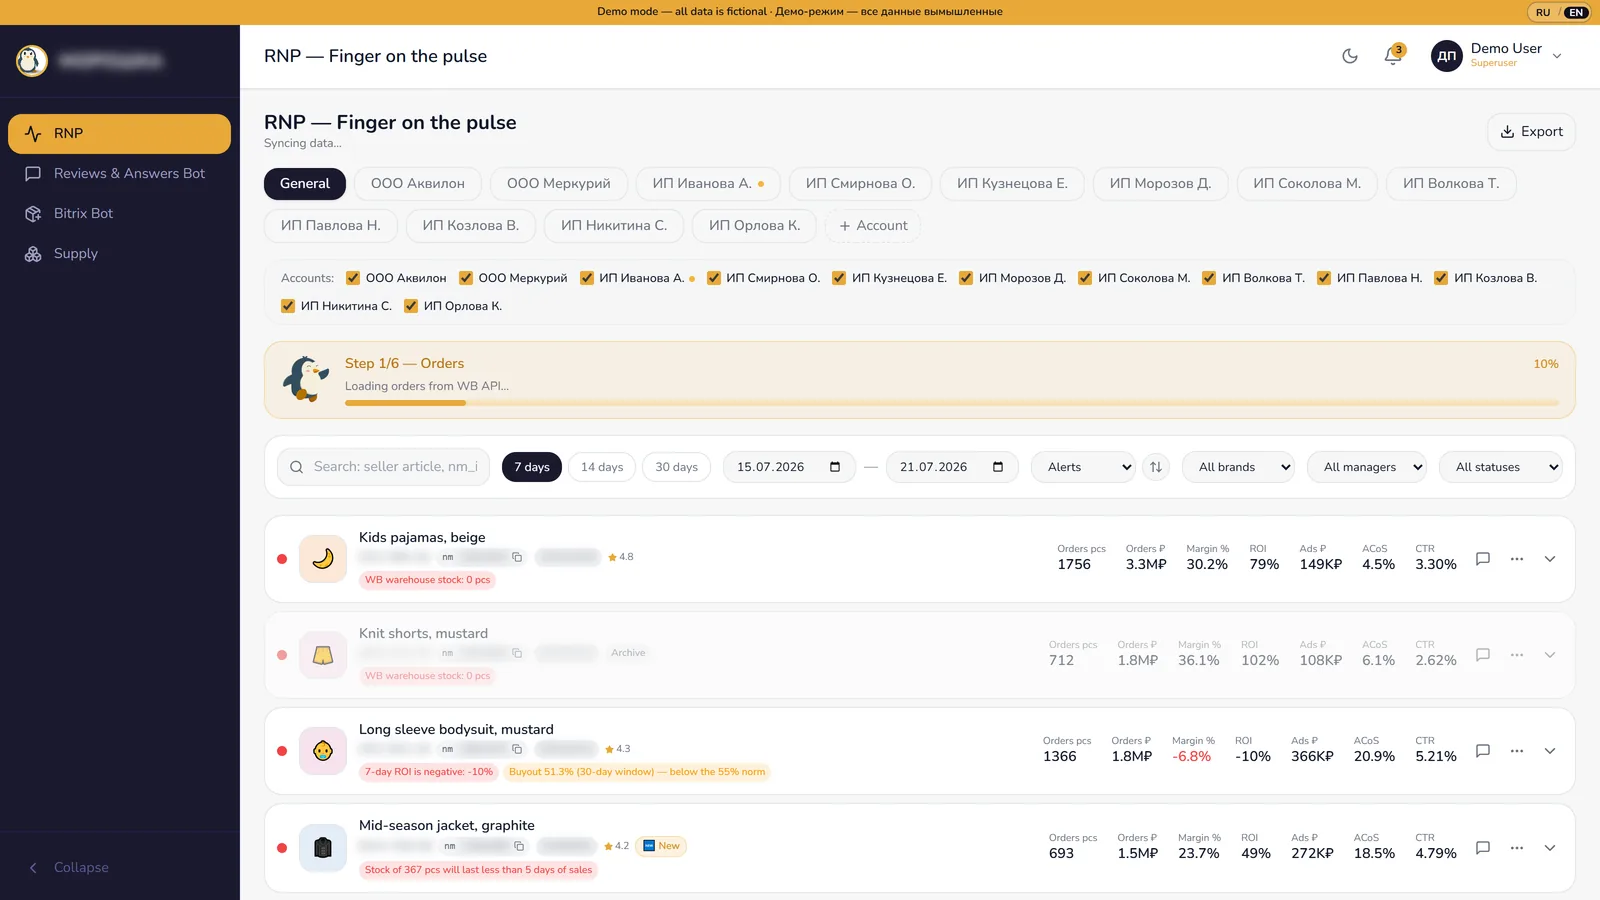
The heart of the system is a daily per-SKU panel the team calls the pulse board. For every SKU and every date it shows about 37 indicators (an internal T1..T37 map): the full sales funnel, advertising economics, confirmed and forecast margin, stock and transit. All of it recalculated overnight, with zero manual input except unit cost and China transit.
Views, add-to-cart, orders, buyouts. Conversion at each step. Cancellations and returns per date. Buyout rate computed three ways, each for its own job.
Spend, DRR (ad cost share of revenue), CTR, CPC, CPM, CPO per SKU per day. Data pulled in 31-day windows with retry queues for marketplace 429s.
Fact margin from the closed finance report. Plan margin from an 8-component model that prices in non-redeemed orders. Effective commission instead of the nominal rate. ROI with one formula everywhere.
Remains per warehouse and size, goods in transit to and from customers, manual China transit. Zero-stock and low-stock alerts instead of eyeballing a thousand rows.
| Metric | Question it answers | How it is computed |
|---|---|---|
| Buyout rate (cohort) | How many orders end as paid sales? | Each order in a 30-day window (7-day lag) is traced to its fate. clean / (clean + returned + cancelled), minimum 30 completed orders. |
| DRR | Is advertising paying for itself? | ad spend / order revenue x 100, counted the same way the marketplace dashboard counts it. |
| Effective commission | What does the marketplace really take? | (retail - payout - acquiring) / retail price x 100 over finance report sale rows. The nominal category rate is shown only as a reference chip. |
| Fact margin | Real profit per day | net revenue - commission - logistics - storage - penalties - acquiring - unit cost - ads. Computed only for days confirmed by the finance report, otherwise shown as a dash. |
| Plan margin | Expected profit before the report closes | 8 components. expected sales = orders x buyout rate. A non-redeemed order still pays two legs of logistics. Frozen daily by snapshot. |
| ROI | Return on money in the game | margin / (unit cost + ad spend) x 100. One formula across list, card and spreadsheet. |
Collecting one daily row per SKU by hand takes 1 to 2 minutes across 5 or 6 marketplace screens. One account alone holds over 1,100 active SKUs. That is 19 to 38 person-hours per day for one account, so sellers usually track only the top 100 SKUs and lose the tail. A conservative estimate of the replaced routine: 250 to 350 person-hours per month, roughly 2 to 4 full-time analysts. The system does it every night and the tail of the catalog stays watched.
Marketplace sellers live or die by response speed and tone. The bot is a three-model LLM pipeline that drafts every reply in the brand voice. A human always presses the send button.
The cheapest model sorts every message into 14 intents: defect return, sizing help, restock, care instructions, delivery, wrong item and more. Identical texts hit a 30-day cache and cost nothing. Star-only reviews skip the LLM entirely and go to a template.
One reply, not ten options. A tool loop lets the model pull the product card when the question is about fabric or care. Hard business rules sit above everything: no promised discounts, no canned phrases, always the brand signature. Every reply carries a confidence score.
Every manager correction is stored as a gold reference. From 161 of them Opus distilled a brand style guide: 24 numbered rules plus 12 per-intent templates. Business bans rank above learned patterns, by explicit design.
The starting queue: 210 unanswered reviews and 1,023 questions across the accounts. A single offline generation session produced and loaded 60 review replies plus 661 question replies for the most backlogged account. Per the client's estimate, the work of about 6 employees was taken off review duty.
Prompt engineering with a measurable result: the input prompt shrank from 6-8K tokens (80 raw examples) to 1.5-2K tokens (distilled style guide plus 7 references per intent). Plus caches at every step and short-circuits for empty reviews.
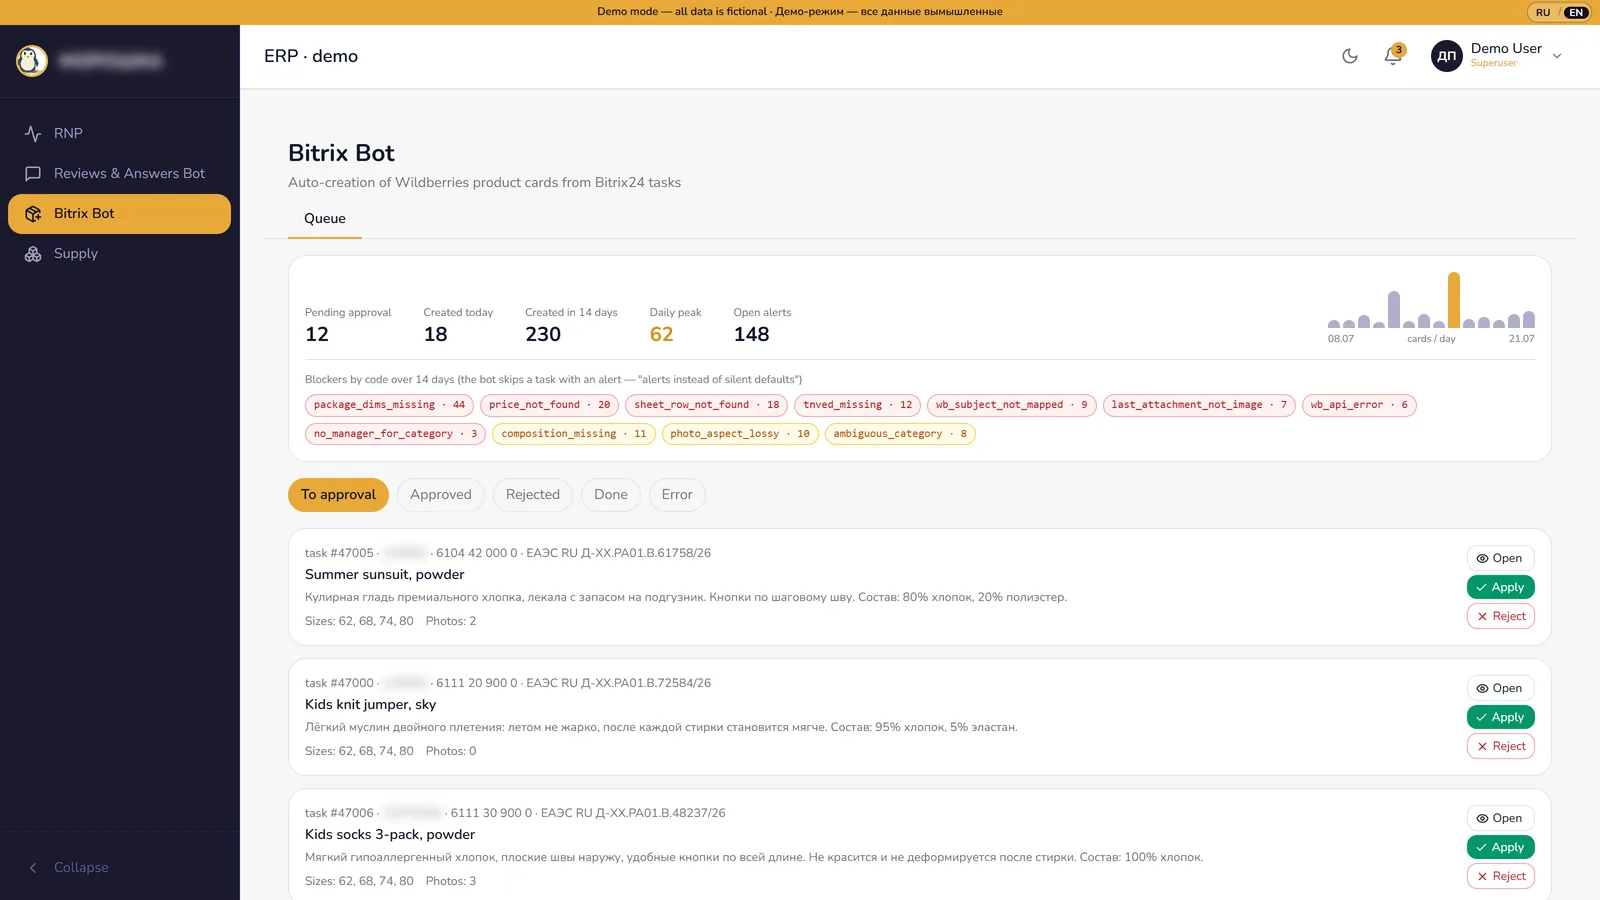
The purchasing team plans new products as tasks on Bitrix24 kanban boards. The pipeline turns a finished purchasing task into a complete marketplace product card: parsed attributes, barcodes, category, brand, manager, photo. What took 15 to 30 minutes of manual work across 3 systems became a supervised conveyor.
The trigger is a kanban stage: goods purchased. The pipeline pulls the task title, description, comments and attachments. A regex parser of about 480 lines extracts price, cost, fabric composition, color, the full size grid with quantities and package dimensions. Category and customs HS code come from the nomenclature Google Sheet the managers maintain. Brand and responsible manager are assigned by round-robin rules. Then: barcodes per size, card upload, photo cropped to 900 x 1200, and write-backs to the sheet and the original task.
The parser is deterministic regex, not a model. Same input, same output, testable with regression tests pinned to real incidents, zero inference cost and no hallucinated prices. The module was built from detailed written specs: data contract, formulas, edge cases and acceptance checks. The rule of the module: hard alerts instead of silent defaults.
On its first full run over 142 tasks the pipeline created zero cards. Instead it produced an exact classification of 141 data blockers: 42 tasks without package dimensions, 21 without price, 38 without category rows. Managers received precise to-do lists. Within days the same pipeline was producing up to 62 cards per day. Idempotency at 4 levels means a rerun never creates duplicates, and the invariant is strict: one task equals one full cycle across all 3 systems, verified 3 ways.
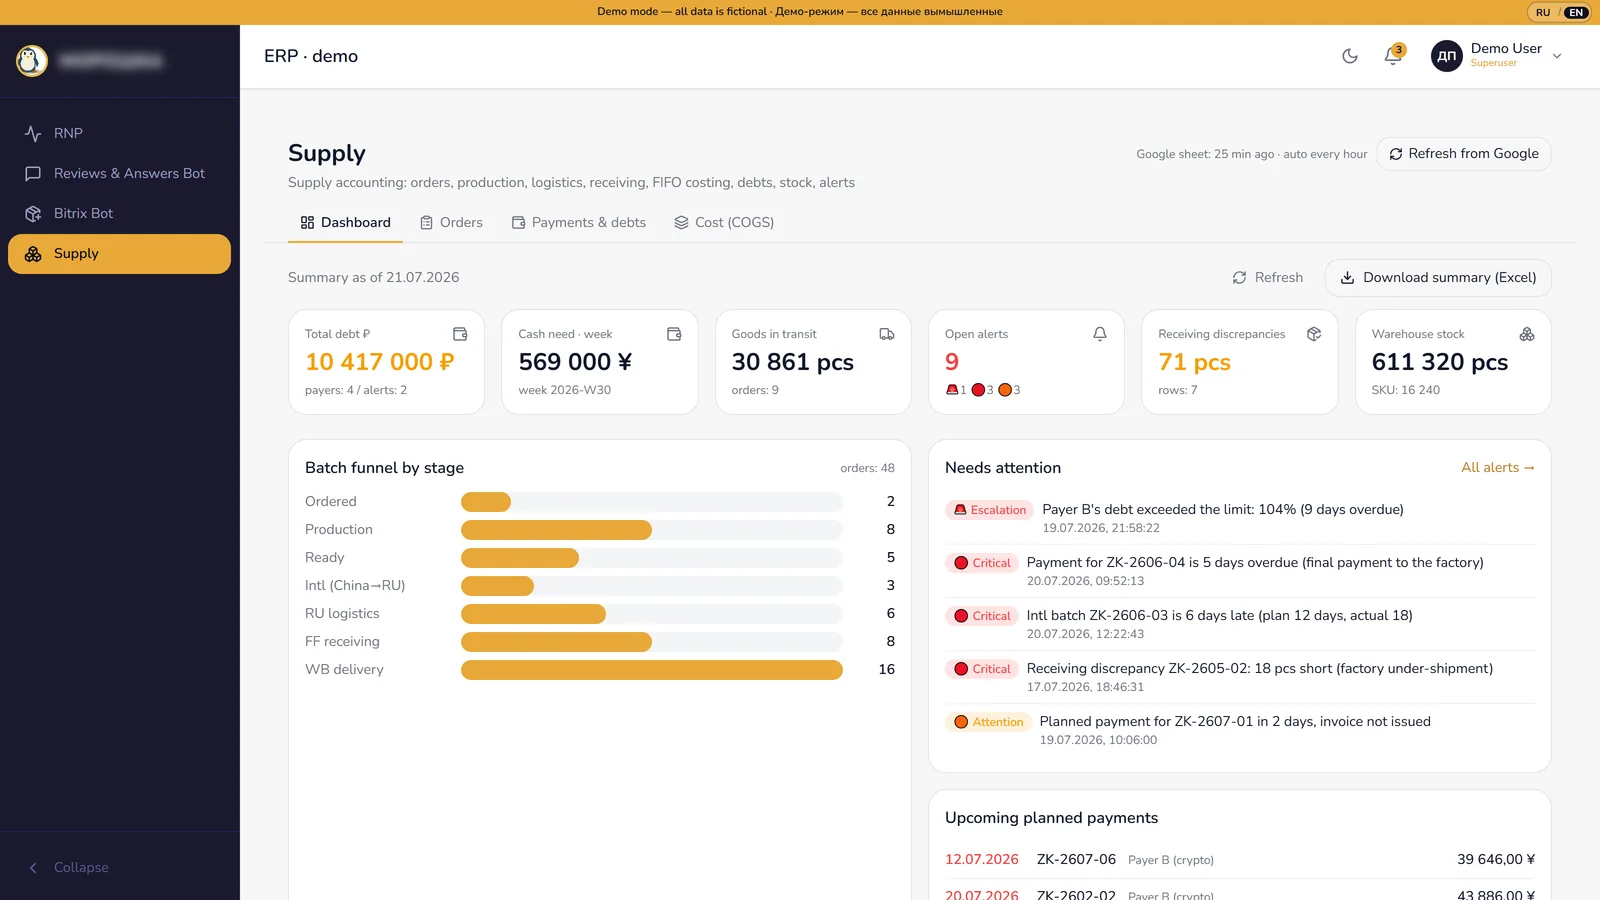
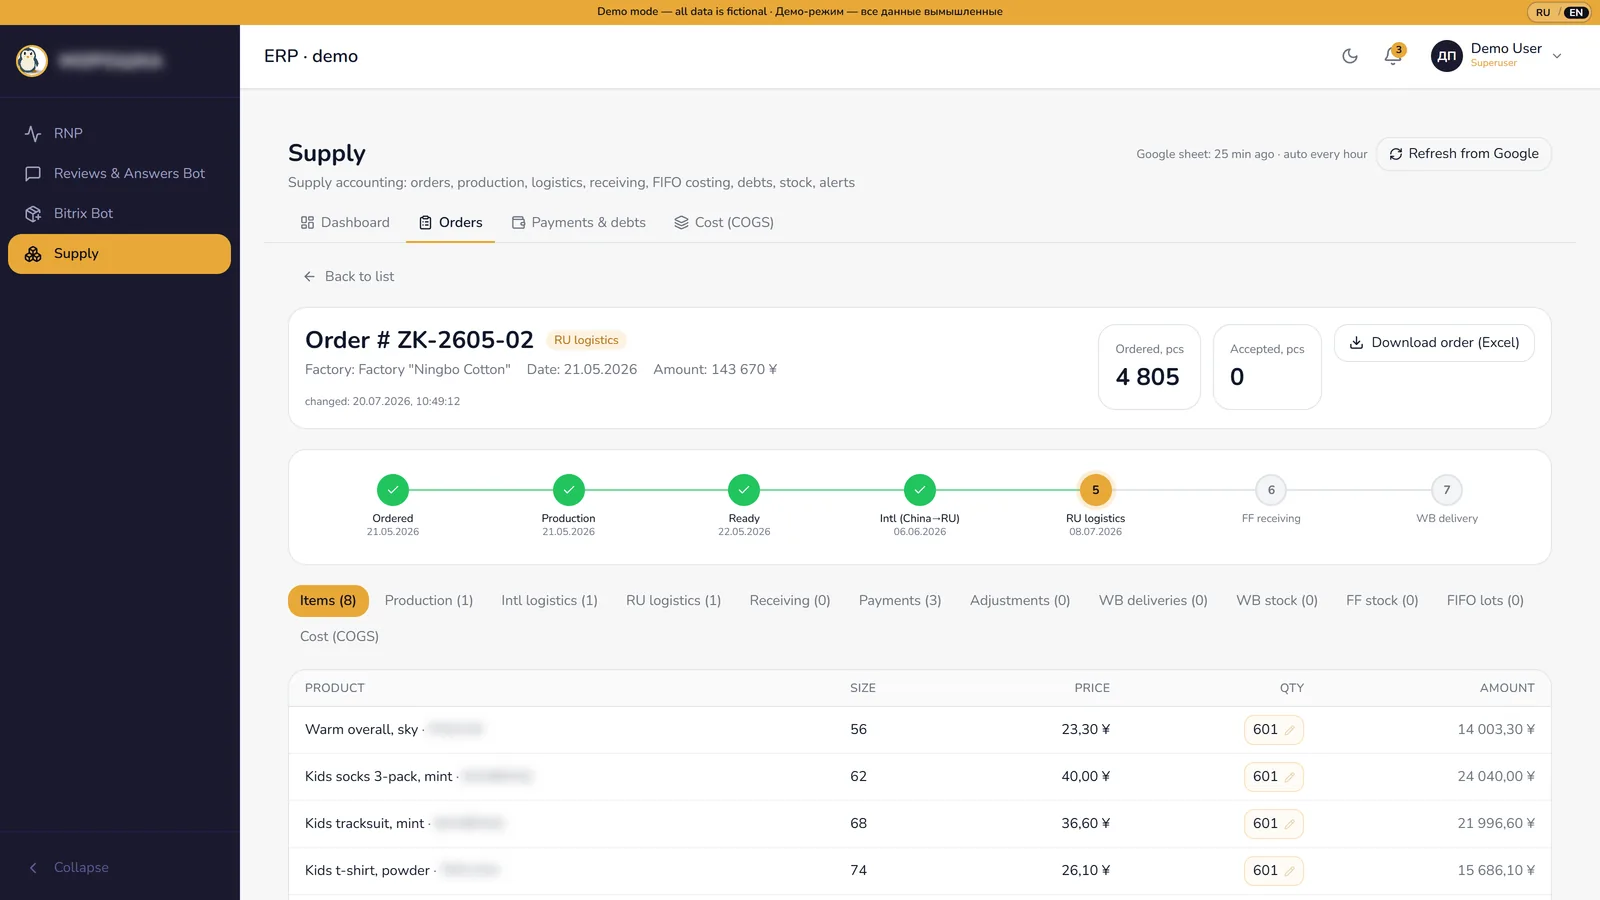
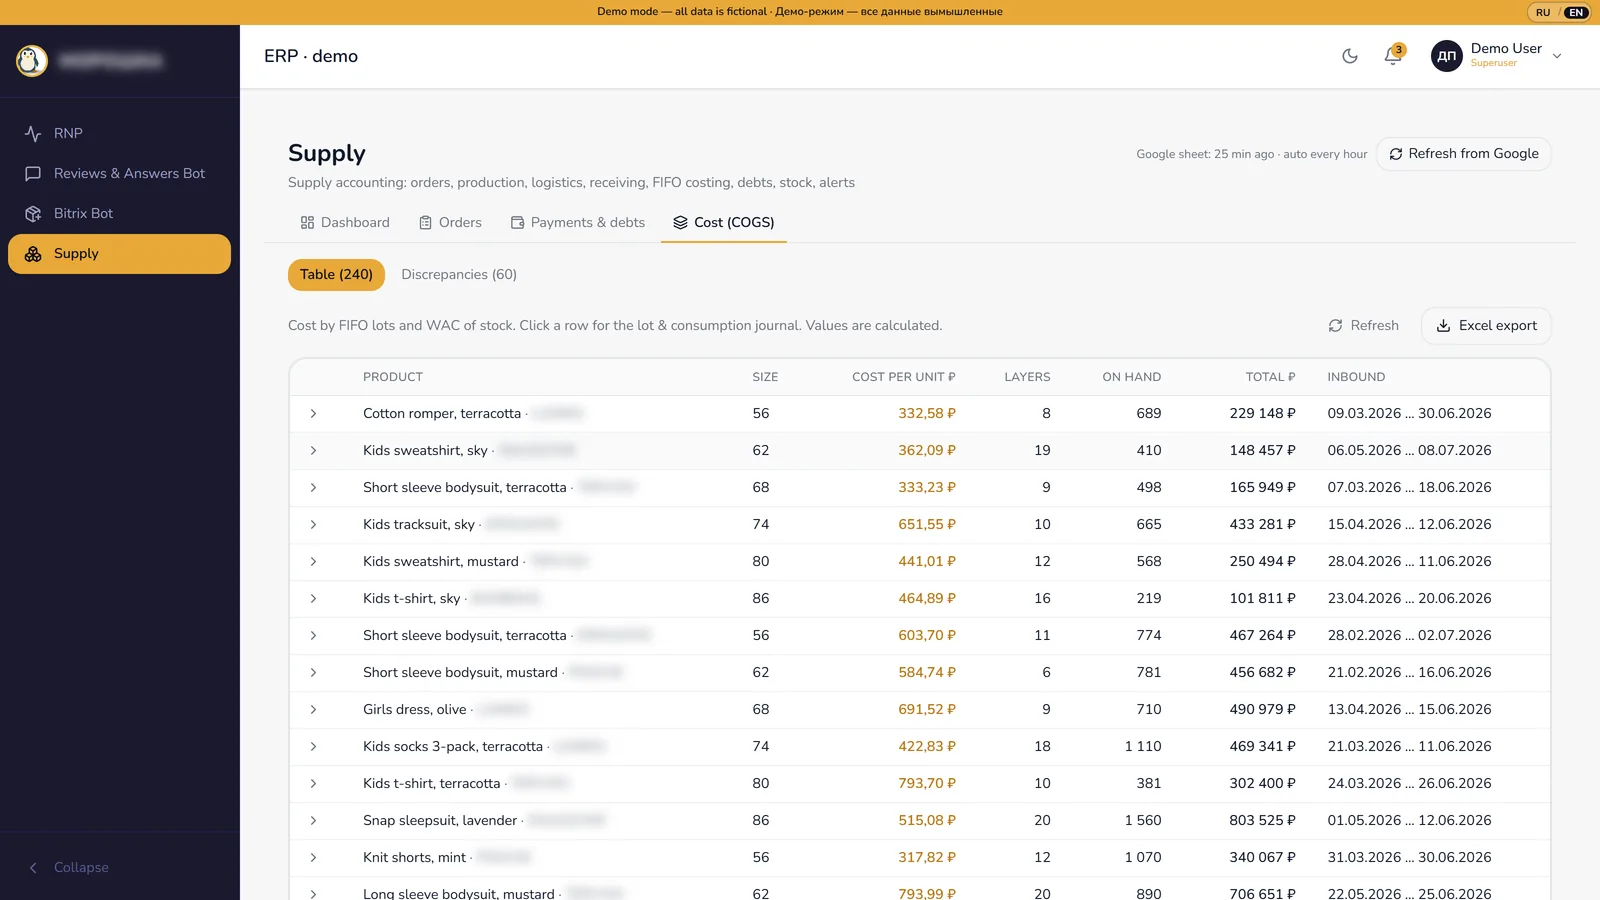
Factory orders, production, international and domestic logistics, fulfillment receipts, debts to suppliers and true FIFO unit cost. The module went from zero to production in about 3 weeks and became the financial backbone of the system.
Every receipt creates an immutable cost lot: goods in yuan, international logistics in dollars, domestic legs in rubles, fulfillment handling. Currencies are converted at the central bank rate on the payment date. Each sold unit consumes the oldest lot, returns restore into the newest layer, and everything is idempotent per sale line.
A debt ledger per payer with limits, planned payments and weekly snapshots. The dashboard answers the owner's question directly: who do we owe, how much cash does next week need, and where are the goods right now, from factory to warehouse shelf.
13 deterministic SQL alert rules watch the chain: an order stuck in planning, production not started in time, payment sums that do not match order sums. Severity levels, auto-resolve, and an audit log on every mutation. 29 Excel report exports for the finance team.
Managers loved their spreadsheet and hated the idea of a new tool. So the spreadsheet stayed. The backend now fills it.
Every morning the bridge bootstraps 200+ values per SKU into the familiar sheet: prices, commissions, funnel conversions, stock, buyout rates, yesterday's ads. Managers type only their action plan and notes, and those edits flow back into the database. A 40-metrics-by-14-days daily history ships as a 20-30 MB gzipped response and renders as the archive tabs they already knew.
Security is strict: hashed service tokens plus a spreadsheet whitelist. A sheet is mapped to exactly one seller account and physically cannot read another account's data.
Zero retraining, zero adoption fight, zero parallel-tool period. The team kept its habits while the data under those habits became a database instead of copy-paste. This is the cheapest change management there is: move the system to the people, not the people to the system.
One analyst-developer, changes shipped as small, reviewable steps. That is the methodology fact, not the headline: the headline is that the business runs on the result.
| Area | Before | After |
|---|---|---|
| Daily analytics | Manual copy-paste from 5-6 marketplace screens. Only the top SKUs tracked. An estimated 250-350 person-hours per month of routine. | Nightly recalculation of ~37 metrics for 1,100+ SKUs per account. The whole catalog watched, alerts surface problems. |
| Margin visibility | Some margin, once a week, after the finance report closed. | Fact and plan margin per SKU per day, with an explicit marker of which days are confirmed. |
| Reviews and questions | A queue of 210 reviews and 1,023 questions. Managers wrote each reply by hand. | AI drafts in the brand voice, human approves. Per the client's estimate, work of ~6 employees taken off this duty. |
| New product cards | 15-30 minutes of manual work per card across 3 systems. | A supervised pipeline, up to 62 cards per day at peak, with typed alerts on bad input data. |
| Unit economics | Approximate unit cost in spreadsheets, no landed-cost view. | FIFO landed cost across 3,256 lots and 608K units, debts and cash-need on one dashboard. |
| Tooling | 12 separate marketplace dashboards plus disconnected spreadsheets. | One ERP: ~298 endpoints, 110 tables, a web app and the familiar Sheets, all on the same database. |
Business analyst and systems builder. I start with the business process and the data contract, then automate. This system was analyzed, specified and shipped by one person for a live $4M-a-month business.