A unit economics dashboard that explains every ruble
A tool for the owner of an auto parts business on Ozon, a major e-commerce
marketplace. It computes true profit per unit across 9 cost lines, keeps the ad budget
inside a hard limit and tells the owner how much cash is safe to withdraw.
Built fast, in days. Stage one is recommendations only: every number carries
its explanation, and nothing is applied automatically.
real sales processed in 3 months of live operation
01 Context and pain
Ads were burning cash. Economics ran on gut feel.
A seller of starters, alternators and wiper blades on Ozon. Dozens of SKUs, FBO logistics,
a third-party storage warehouse, live ad campaigns. The marketplace cabinet shows revenue.
It never shows profit per unit after all the fees.
Profit per unit was unknown
Price minus purchase cost is not profit. Marketplace commission, two legs of logistics, storage, ads, defects, overhead and tax all take their cut. None of that was visible per SKU.
Advertising without a guardrail
Campaigns kept spending, but nobody tracked DRR per SKU. DRR is ad spend as a share of revenue, the key efficiency metric on Russian marketplaces. A campaign can sell a lot and still lose money.
Restocking by intuition
An FBO supply takes weeks of lead time. Order too late and the bestseller goes out of stock. Order too early and cash freezes on the shelf. There was no per-SKU view of days of stock left.
How much can the owner take out?
Withdraw too much and the next restock is starved. Withdraw too little and the business pays no one. The answer changed with every look at the cabinet, because nobody knew the real net profit.
02 System architecture
From two Ozon APIs to one owner screen
Sync jobs pull products, sales, stock, finance transactions and ad statistics into PostgreSQL.
Ten analytics modules turn raw rows into unit economics, plans and recommendations.
The owner works in a single dark dashboard: 10 sections, 5 charts, one screen.
External sourcesSync and analytics servicesData storeOwner surfaces
48HTTP routes in 7 routers
29tables, 6 Alembic migrations
~3,000lines of analytics logic
2,005lines: the single-file dashboard SPA
11 + 1CSV templates + 7-sheet Excel master
A detail that matters for trust: financial numbers follow a fact-first cascade. The actual value
from Ozon finance transactions is used when it exists, the published tariff rate is the fallback,
and a historical average is the last resort. The dashboard never silently invents a number.
Without API keys the whole system runs on mock data, so a full demo needs no real cabinet.
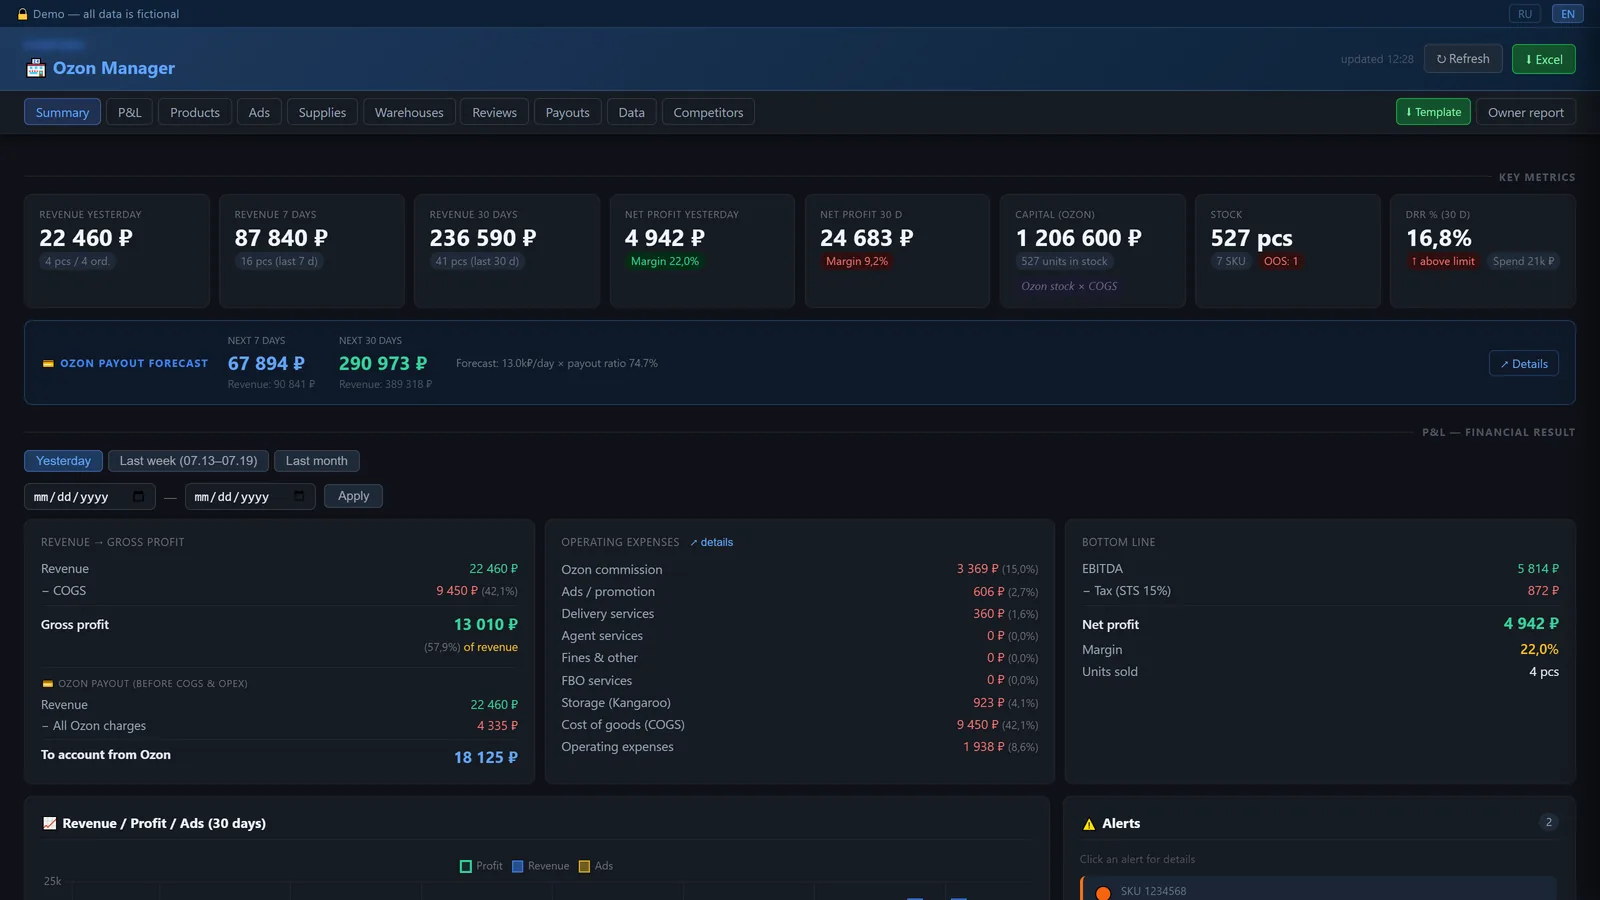
The summary section: 8 KPI cards (revenue, net profit, capital in stock, DRR) and the Ozon payout forecast bar.
03 Flagship module
Unit economics: 9 cost lines between price and profit
For every SKU the calculation starts from the actual sale price found in Ozon finance
transactions, not the list price. Then it subtracts every ruble on the way to net profit
after tax. Each line states where its number came from.
+
Actual sale priceaccruals for the sale from finance transactions, divided by quantity sold
−
Purchase cost (COGS)imported from the owner's Excel, per batch
−
Ozon commissionactual fee from finance lines; fallback: category tariff; last resort: historical average rate
−
FBO delivery logisticsactual delivery charge per sale; flat-rate fallback when the fact is missing
−
Return logisticsthe return leg for non-buyouts, from actual return delivery charges
−
Third-party storageaverage daily warehouse rate multiplied by the period, divided by units
−
Advertising per unitcampaign spend attributed to the SKU, divided by units sold
−
Defect reserve5% of COGS reserved for defective units
−
Allocated overheadoperational expenses spread across units
−
Taxsimplified regime, 15% of the profit base
=
Net profit per unit, after taxplus margin %, flags for every violated policy rule and a plain-text explanation
Three policy filters on every SKU
The owner's minimum standards are part of the configuration, not of someone's memory. Every SKU is checked against all three on every recalculation.
Margin≥ 15%
Profit per unit≥ 100 RUB
DRR (ad share)≤ 20%
A SKU that breaks a rule is flagged on the dashboard, with the exact cost line that killed the margin named in the explanation.
P&L after tax, any period
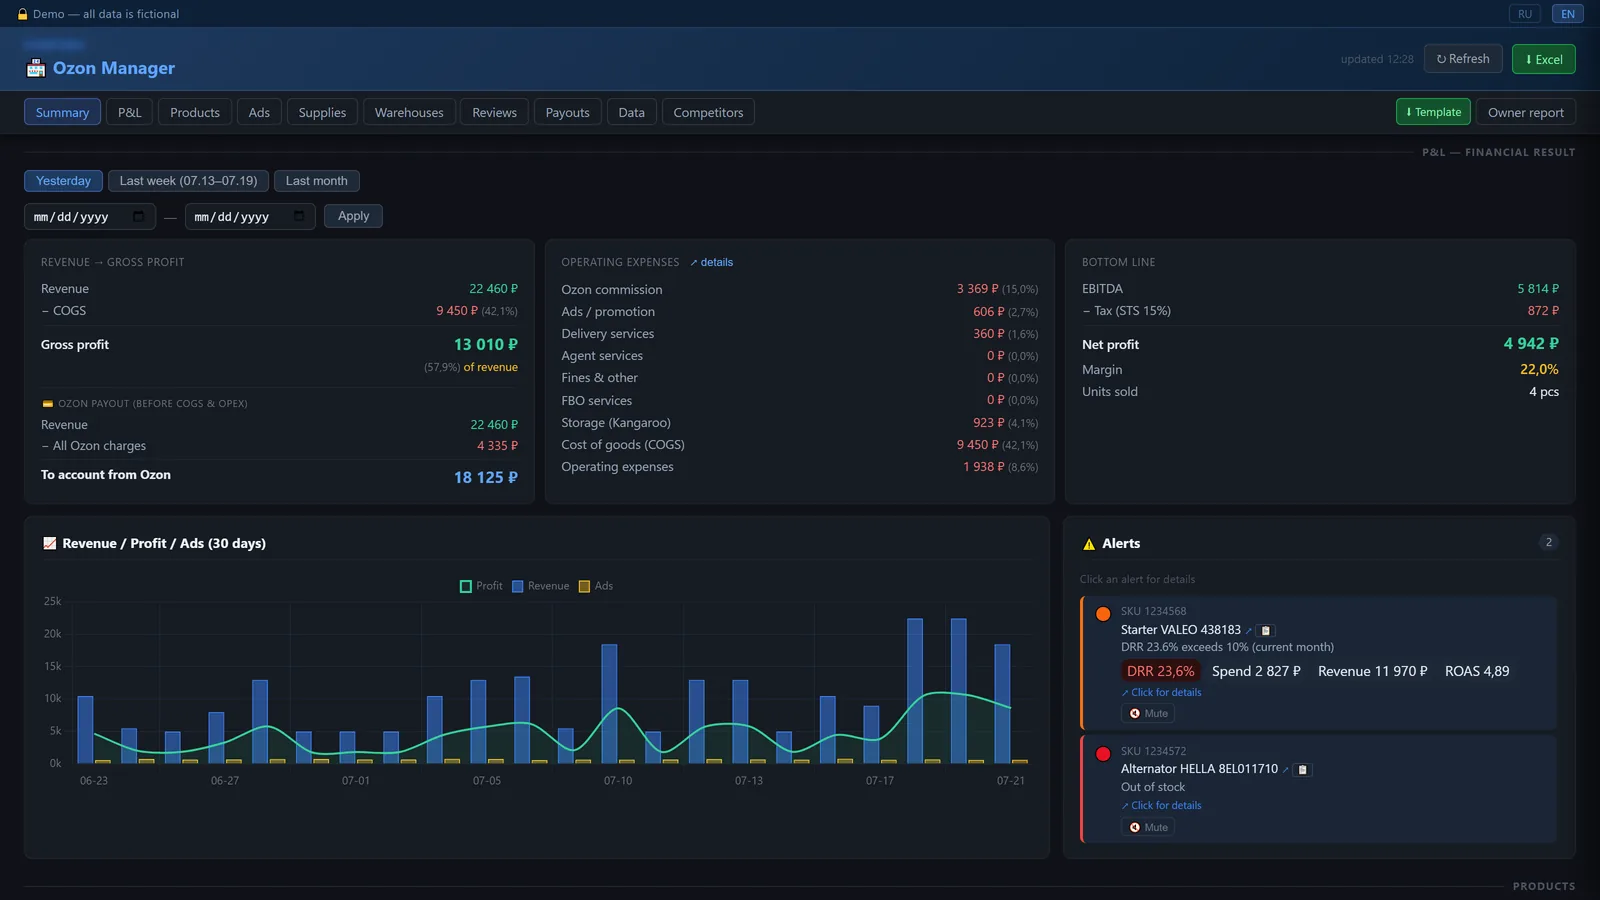
Day, week, month or any custom date range. Full cost breakdown per period, net profit after tax and growth versus the previous period. An alert panel watches out-of-stock, low stock under 14 days, missing COGS and high DRR, with a per-SKU drill-down side panel.
Explainable by design
Recommendations only. Reasons always.
Stage one changes nothing by itself. Every calculation ends with an explanation: which
data source was used, which fallback fired, which policy rule was violated. The owner can
always answer the question "why does the dashboard say that?" without reading code.
Transparent rules instead of a black box.
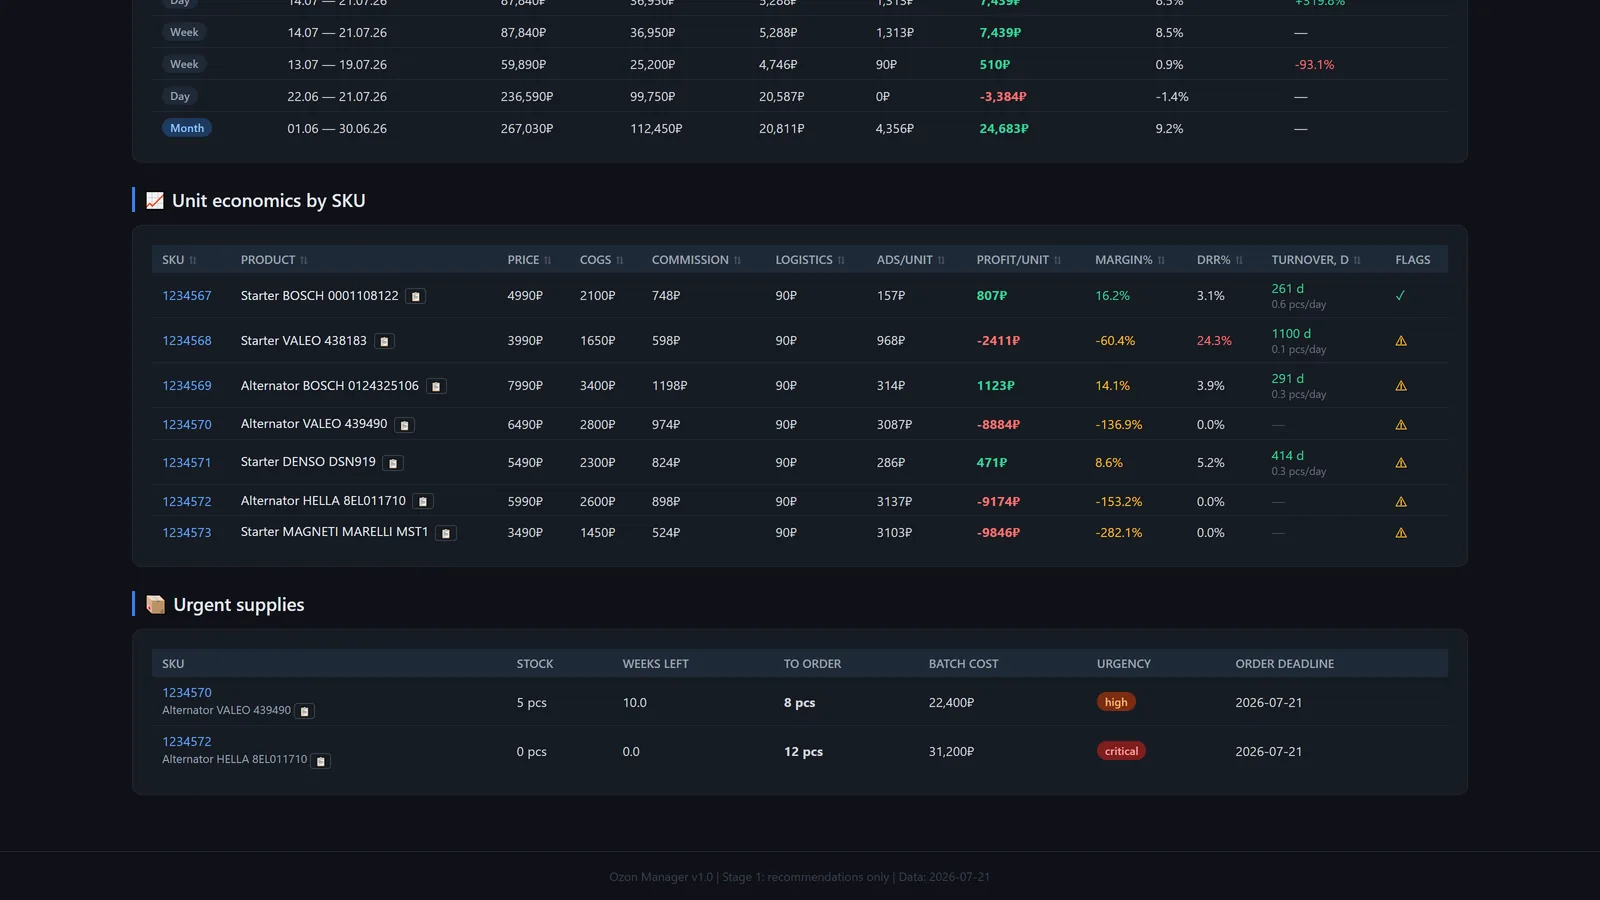
P&L: period tabs, cost breakdown, the 30-day revenue / profit / ads chart and the alert panel.The reports page: sortable unit economics per SKU, with margin, DRR and the color-coded turnover column.
04 Advertising module
Ads: DRR, ROAS and a budget that follows rules
The ads section joins Ozon Performance statistics with real sales. Spend, clicks, CTR, orders
and revenue from ads, DRR and ROAS, all over a rolling 30-day window. On top of the numbers
sits a weekly budget plan with three transparent rules.
DRR under a hard limit
DRR is ad spend as a share of revenue. The dashboard shows it as a chip: over the limit or within norm, visible at a glance. The limit itself is the same 20% used by the unit economics policy filter.
ROAS with a target
Revenue from ads divided by ad spend. The dashboard treats 3 and above as healthy. Together with DRR it answers the only question that matters: is this campaign making or losing money?
Organic vs paid
Sales are split into organic and ad-driven, so the owner sees how much would sell anyway. The budget structure chart shows where every ad ruble goes across SKUs.
The weekly budget plan
Base budget. 3,000 RUB per SKU per week as the starting point, split into a daily plan by weekday.
DRR above the limit: cut. The SKU's budget is reduced and the recommendation says by how much and why.
DRR under 5%: scale up. Cheap demand is not left on the table; the system suggests raising the budget.
Out of stock: pause. Advertising a SKU with zero stock burns money twice. The plan pauses it and says so.
These are the same moves a careful ad manager would make. The difference is that the system
makes them consistently, for every SKU, every week, and always shows its explanation.
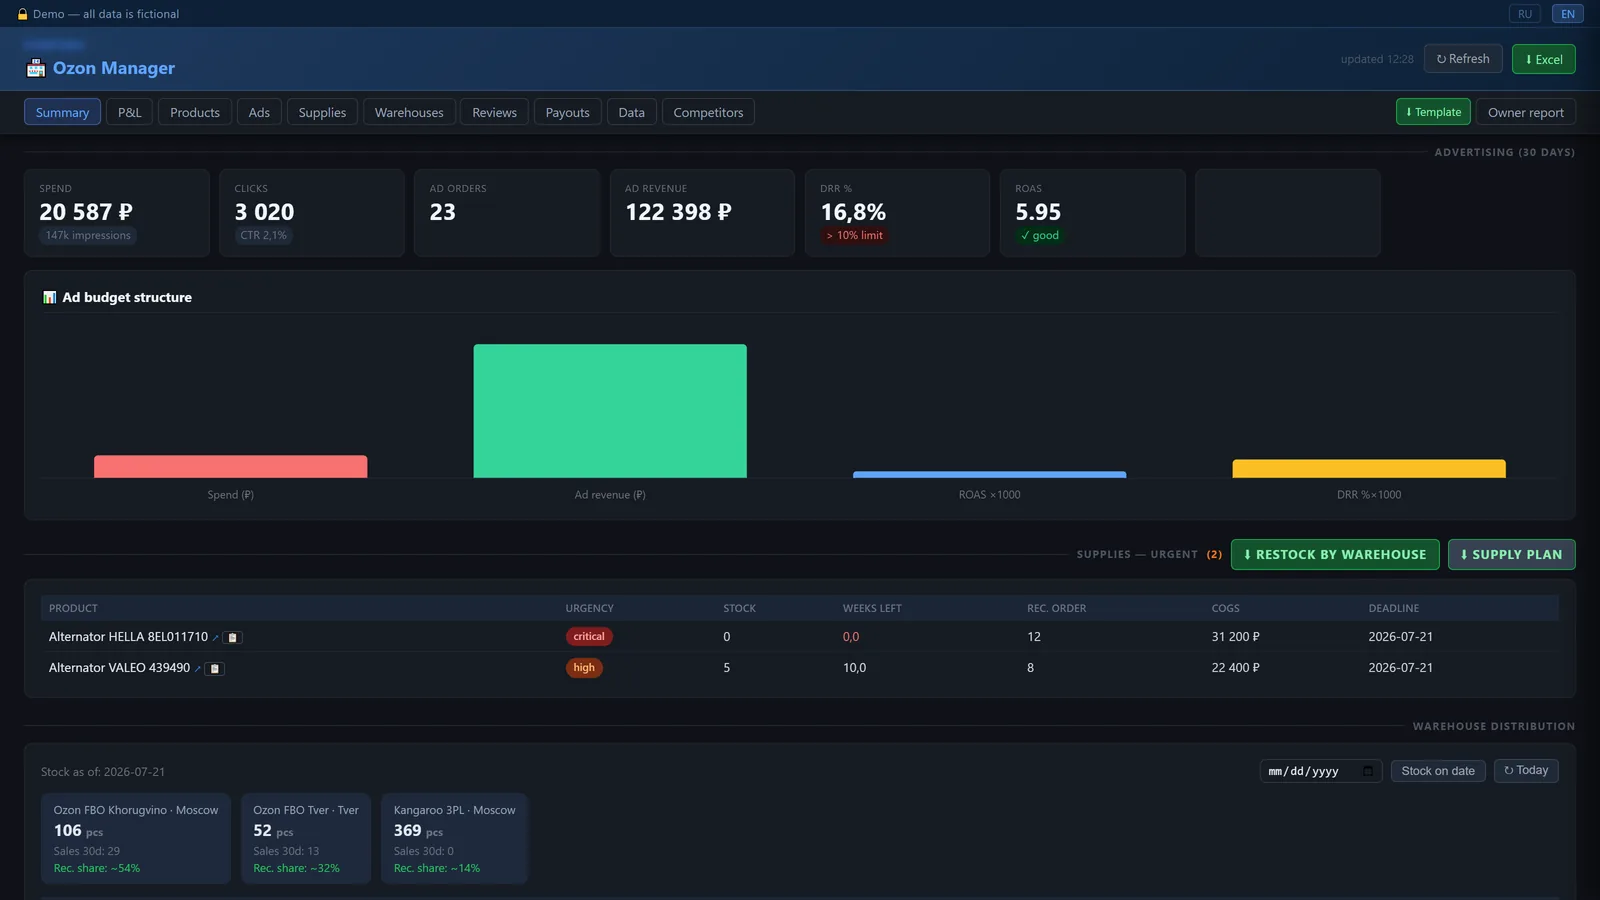
The ads section: KPI strip with spend, CTR, DRR chip and ROAS, plus the budget structure chart.
05 Turnover and supply
Days of stock, sales velocity and a supply plan with deadlines
Every SKU shows its turnover: days of stock left and sales velocity, computed from real sales
over the last 30 days. A color scale makes the risk readable in one glance: 14 days or less is
red, 30 or less is amber. On top of it, a replenishment plan turns risk into a purchase order.
Lead time is respected
The plan assumes a 12-week supply lead and targets selling the ordered batch within 8 weeks. It works backwards from stock and velocity to an explicit order deadline per SKU.
Urgency, not noise
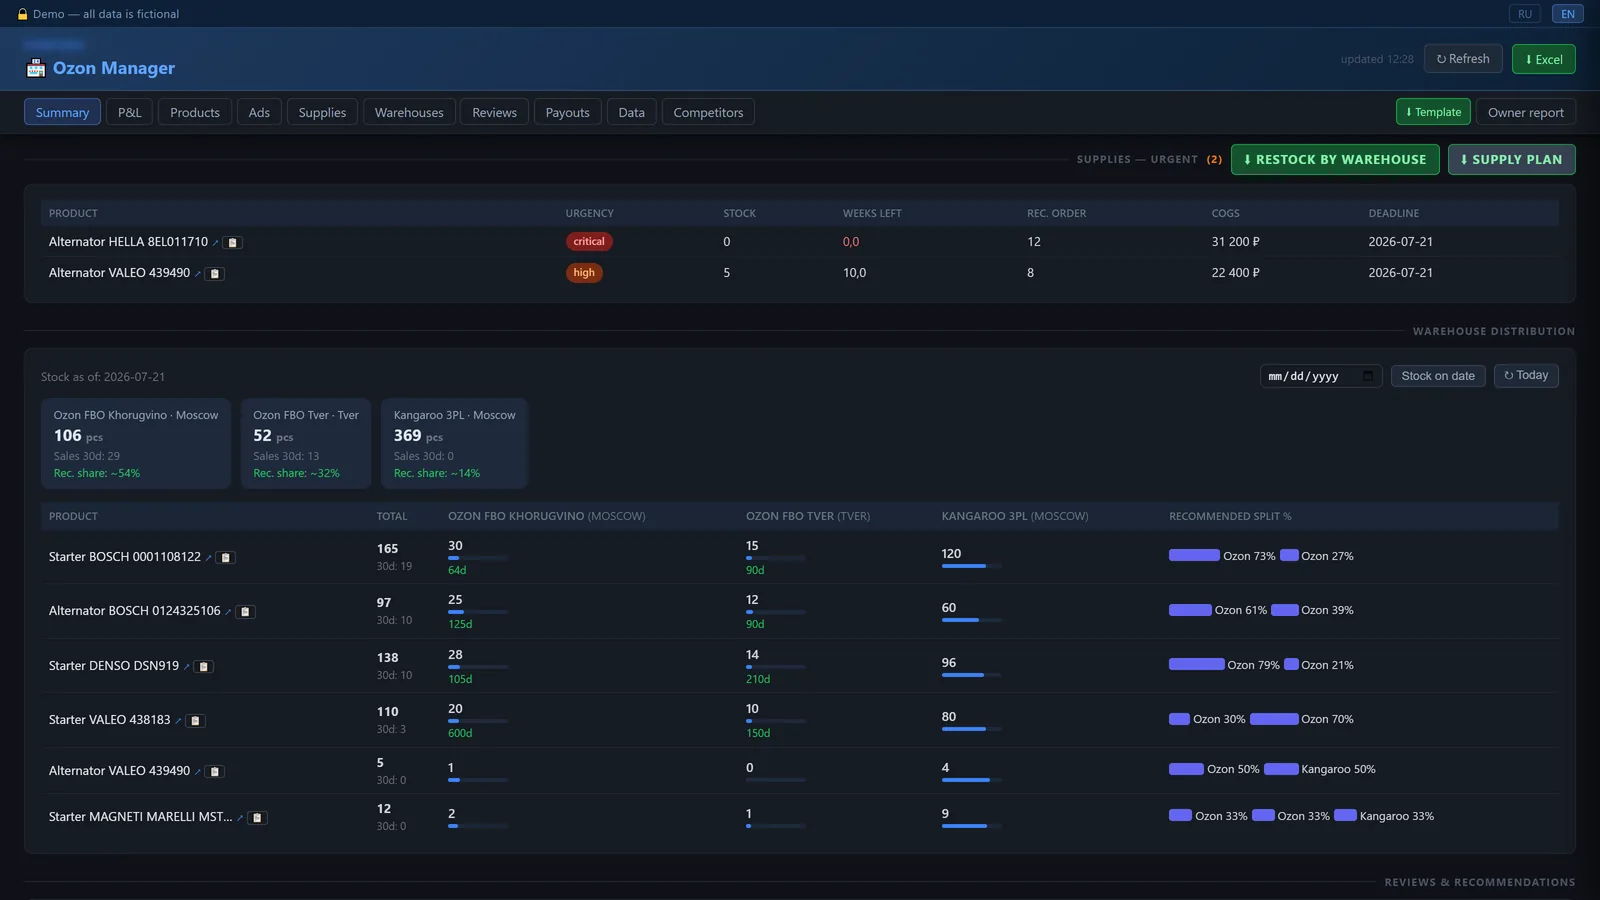
Positions are ranked critical or high, with the recommended order quantity rounded to pack multiples and the batch COGS estimated next to it. The owner sees a short list, not a wall of numbers.
Excel for the supplier workflow
Two one-click exports: the supply plan and the warehouse distribution sheet. The plan leaves the dashboard in the format the supplier chain actually uses.
12 wkassumed supply lead time
8 wktarget sell-through for an order
≤ 14 dof stock renders red
3Excel exports for operations
The supply section: urgent positions with weeks of stock left, recommended order, batch COGS and the order deadline.
06 Owner's finances
The owner's payout, written as code
The most owner-specific module in the system. The withdrawal policy is not a habit,
it is configuration the dashboard applies every month.
Baseline150,000 RUB / mo
Growth bonus+ up to 20% of net profit
The bonus applies only when net profit grew against the previous period. A weak month
automatically protects the working capital: the dashboard suggests the baseline and
explains why not more. The same section forecasts the upcoming Ozon payouts for the
next 7 and 30 days, with a drill-down into what makes up the sum.
Why this matters
Financial discipline is usually a promise the owner makes to himself. Here it is a formula:
growth funds both the owner and the next restock, a bad month does not get amplified by
an oversized withdrawal. It is a small module, and it is the clearest example of what this
tool is: business rules made executable and explainable.
07 How it was built
Built fast, in days, and honestly scoped
This is not a three-month ERP. It is a focused owner's tool: the code was built
fast, while the human owned the business rules and the numbers.
commit 1The whole working system in one commit, made with Cursor. FastAPI, 29 tables, sync layer, analytics, the dashboard. Roughly 15,800 lines laid down as the clean baseline.
commit 2One large feature commit: 22 files, +3,259 / −291 lines. The turnover column computed from real 30-day sales, the payout forecast endpoint, a 359-line finance sync, sortable unit economics, rolling 7 and 30-day windows, two migrations.
Deployment designed for operation. The VPS runbook documents installing and maintaining the system right on the production server, and the hosting region was chosen for the operational requirements. Maintenance is part of the operations plan, not an afterthought.
Demo without secrets. A built-in mock mode runs the full system without any API keys, with seeded fictional SKUs. Useful for demos, useful for development.
Honest scale. The public repository is a polished snapshot. There is no test suite and the frontend is a single 2,005-line file. That is the point of the case: a working owner's tool, not a production-engineering showcase.
Proven in real operation. The tool ran against a live seller cabinet: 57 to 64 SKUs, about 2,700 sales over 3 months, 363 finance operations synced and reconciled.
Price minus purchase cost, on gut feel. Fees, storage, ads and tax invisible.
9 cost lines per unit, fact-first from Ozon finance transactions, net profit after tax per SKU.
Advertising
Campaigns spent without a per-SKU guardrail. Ads were burning cash.
DRR limit 20%, ROAS target, a weekly budget plan with 3 transparent rules: cut, scale, pause.
Restocking
Ordered by intuition, out-of-stocks discovered too late.
A supply plan with order deadlines, urgency ranks and pack multiples. Stock colored by days left.
Owner's payout
Withdrawals by feel, working capital at risk in weak months.
A coded policy: 150,000 RUB baseline + up to 20% of net profit, only on growth. Payout forecast for 7 / 30 days.
Trust in numbers
Screenshots of the marketplace cabinet and hand-made spreadsheets.
Every calculation carries an explanation. Recommendations only, a human applies them.
Tooling
The marketplace cabinet plus disconnected files.
One dark dashboard: 10 sections, 48 routes, 29 tables, Excel templates in and exports out.
Kirill Sedov
Business analyst and systems builder. I start with the business process and the numbers
that run it, then automate. This owner's tool was specified and shipped fast, in days,
and it ran against a live marketplace account with every figure explainable.